Development Distribution Score
Development Distribution Score#
The distribution of responsibility and workload among contributors is essential to a stable community. A common way to estimate the risk resulting from information and capabilities not being shared among team members is the so-called Bus Factor. The “bus factor” is the minimum number of team members that have to suddenly disappear from a project before the project stalls due to lack of knowledgeable or competent personnel.
In this study, a proxy is developed to quantify the bus factor, the Development Distribution Score (DDS). The DDS weighs how the development is distributed between project contributors by benchmarking the contributor with the most commits in relation to the other contributors. The distribution of knowledge, work, and governance is critical to a project’s long-term viability. When a project or organisation undergoes significant social or technological changes (for example, personnel leave a project or can no longer contribute), others have the knowledge and capacity to continue with the initiative. The metric compares a project’s reliance on a small number of contributors and, as a result, its resilience to change. Projects with a low DDS appear to be more vulnerable to decisions made by a single organisation or developer, which affect not only other developers or users, but also the dependencies to other projects.
The commits of the strongest contributor are measured in relation to the total number of commits. Although commits are not an absolute measure of an individual’s performance within a project, they do reflect working relationships after a certain period of development. Furthermore, it makes it possible to assess the status of a project without having to make direct comparisons to other projects. The DDS value is calculated using the following formula:
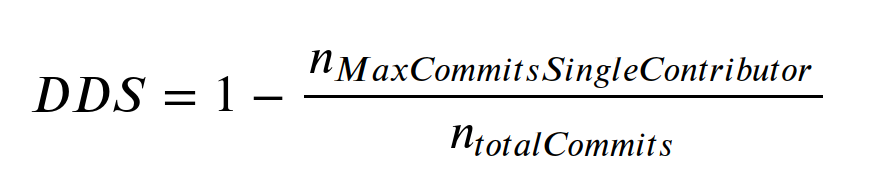
For instance, a DDS of 0.1 means that 90% of the transfers come from a single developer. Without the high engagement of that individual, it will become challenging for the rest of the community to maintain and further develop the existing code base. The following table shows the statistical median of the DDS on the whole dataset.

Fig. 30 - Median Development Distribution Score within various groups of projects#
Across all active and inactive projects, the median DDS is at 0.304. This means that most open source projects depend heavily on a single developer contributing 70% of the commits to a project. For inactive projects, this value drops to 0.136 while active projects have a DDS of 0.335. The highest values are shown for projects within GitHub organisations, with a DDS of 0.405. The top 50 projects (ranked by stars) have a median DDS of 0.415 and the development communities with the most contributors have the highest DDS value of 0.688 demonstrating that workload is more evenly distributed among individuals in a large development community.
In particular, the difference between inactive and active projects makes it clear that the DDS is an important indicator for the longevity of an open source project. However, a high DDS is not advantageous in every case. Brooks’ Law is an observation about software project management according to which “adding manpower to a late software project makes it later”. Especially for projects of high complexity, very large team sizes quickly lead to overhead and communication problems. Under these conditions, the distribution of work between many can become problematic. One solution to this is to split software projects into modular components that can be managed by smaller groups. This approach is known as the Unix philosophy in software development.
The following scatter diagram shows the distribution of DDS within different topics. Each circle represents a project and the size of the circles is scaled relative to the size score.
Fig. 31 - Development Distribution Score within topics#