Topics
Topics#
Project topics have been identified across sectors, technologies and research fields. This mapping process was iterated multiple times as part of the analysis and will continue to evolve as niches develop and emerge. While it may be difficult to compare the scope of the topics directly, the relative size and complexity allows us to identify neglected, vibrant, and emerging areas.
The following scatter plot provides an overview of all projects studied within their respective topics. The size of the circles is proportional to the relative scale of the projects, based on total commits and contributions. The colour bar shows the Development Distribution Score (DDS) as a measure of the distribution of work among the individual developers. A high value indicates a high distribution of work and, thus, a strong developer community. More details about this can be found in chapter Development Distribution Score.

Fig. 12 Overview of all projects of the last 14 years since the launch of GitHub#
45% of all identified projects can be found within biosphere, hydrosphere, water supply and quality, energy system modelling, mobility and transportation, and buildings and heating. This is likely due to the research maturity of these fields, the multitude of scientific organisations behind them, and the relatively good availability of open data in these categories. We can see strong open source ecosystems, particularly in the field of energy modelling and renewable energy, such as photovoltaics or wind energy. However, despite the central importance of batteries for energy storage, only a few OSS projects are under development.
Furthermore, areas where software plays a central role, but only a small number of projects can be identified, are of particular interest. For example, within sustainable investment, representing only 1.15 % (a total of 11 projects), open source is still a marginal factor. Despite ongoing discussions about the quality and transparency of ESG (Environmental, Social and Governance) ratings, the field is dominated by proprietary, closed-source frameworks and datasets. The lack of open source and open science in sustainable investment reflects the lack of transparent impact measurement and evaluation, which is key in financing a sustainable transformation.
In emission observation and modelling, only 22 developments have been identified, representing 2.1% of all projects. Despite the significant impact of anthropogenic emissions on the climate, there is a lack of open source tools, platforms, and communities that truly reflect the magnitude of the challenge. A significant business opportunity would exist for an open source community to bring together various emissions monitoring and modelling datasets from around the world on a single platform. A platform like this would be critical for increasing transparency around pressing issues like carbon trading, carbon taxes, and company sustainability assessments. There are new promising developments in this space, such as The Global Registry of Fossil Fuels. Moreover, Electricity Maps has successfully demonstrated how this approach works when applied to local energy grids. It has made it possible for hundreds of scientists and developers to collaborate in an open way and combine existing public data into a single digital platform.
Fig. 13 Number of individual projects within topics#
Topics with low OSS representation include bioenergy, hydrogen, and carbon capture. This is likely due to the more nascent nature of these areas and the relatively smaller academic communities working in them. These technologies have a higher degree of uncertainty, with intellectual property closely guarded by a few for-profit companies. Despite continuing to attract large amounts of funding from government and investors, the small number of open source projects associated with these technologies makes it difficult to quantify – transparently and independently – the state of, and potential contributions towards sustainable development. In the topic of industrial production (with respect to energy and resource consumption) only a single project was discovered even after intensive research. That’s why the topic was removed from further investigations.
Lastly, topics like carbon offsets or climate neutrality disclosures could not be investigated in depth due to a general lack of OSS projects. Despite intensive research, no OSS project or organisation (with the exception of CarbonPlan) could be found that provides comprehensive and scientifically sound calculations and methodologies of climate neutrality and carbon offsets claims made by individual companies. All statements about the environmental impact of companies are primarily based on black box algorithms and analyses performed by companies and consultancies, making sustainability claims of Carbon Offsets rather opaque.
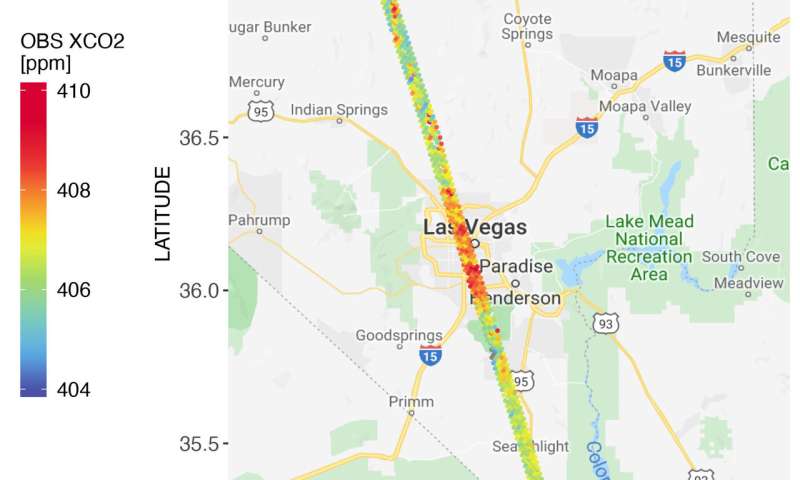
Fig. 14 - The goal oco2peak is to localise CO2 emissions on Earth based on the the carbon concentration data measured by the OCO-2 Satellite from NASA. It is one of the few open software tools that have been released in the field of emission observation and modelling.#