Ranking
Contents
Ranking#
Ranking all projects by a total score can provide a much deeper understanding of the ecosystem. While quantifying the state and health of a project remains challenging, using a multidimensional index creates a more comprehensive picture. A repository’s total score is a composite index of three dimensions: size, community and activity. Each dimension contains several indicators, represented by an index used to rank projects relative to each other. Each dimension index is referred to as a score.
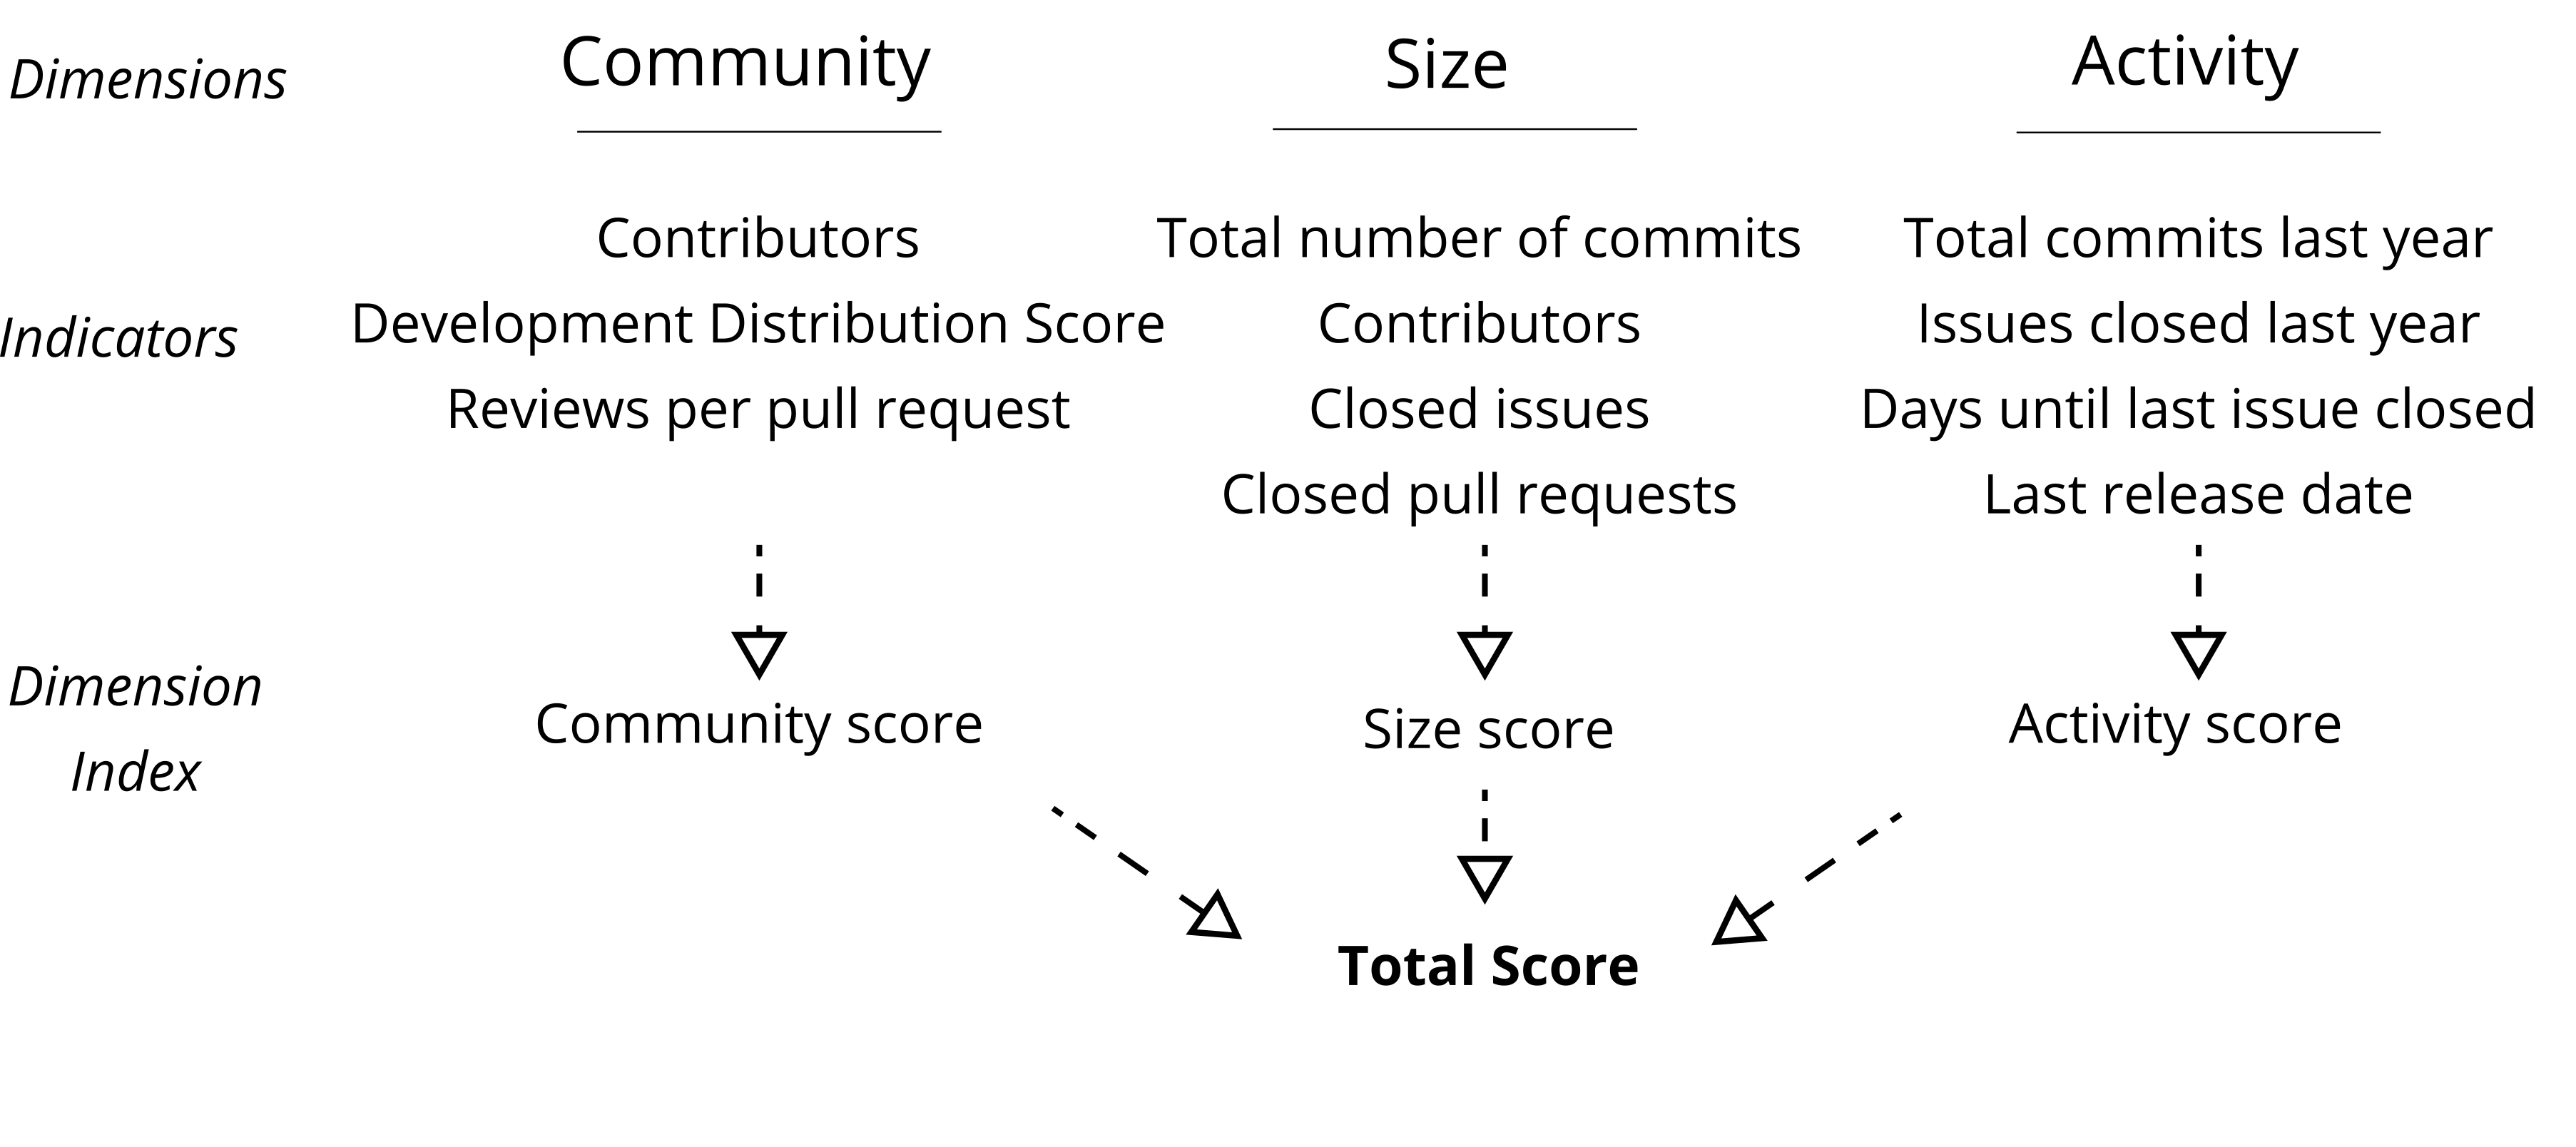
Fig. 22 - The relationship between the dimensions and indicators within the ranking.#
For example, the activity score ranks each project using an index composed of Total Commits Last Year, Issues Closed Last Year, Day Until Last Issue Closed, and Last Release Data, which is normalised by 1. The weighted sum of all scores (activity, community, and size) is referred to as the “total score”. The figure above shows the relationship between the dimensions and indicators within the ranking (for implementation detail, see this code cell.)
Unlike stars, which can provide insight into a project’s overall popularity, ranking by total score unveils unpopular but otherwise strong projects. For example, larger projects like EnergyPlus suddenly rises to the top. However, as with any index, there are limitations. In this case, monolithic software developments have a higher probability of achieving a high score, meaning that projects which rely more on a modular approach (i.e., projects distributed across multiple repositories) may be significantly underrepresented.
The ranking of the projects according to their activity rating highlights the young projects that are still developing rapidly. DeepTreeAttention in particular stands out here, which is mainly developed by a single person. Other young projects such as Ozon3, cmip6-downscaling or PowerSimulations.jl show not only a very high activity but the DDS also shows a strong growth of the community of this young projects.
The real value of such health analytics comes into play when development and community data is combined with usage data. Unfortunately, this data is currently only available to a limited extent via Python dependencies. Further work is required to extend usage metrics to include other software package managers and survey methods.
Tip
Click the project name and go directly to the repository.

Fig. 23 - The 40 Projects with the highest total score#
Fig. 24 - The 40 Projects with the highest activity score#
Fig. 25 - The 40 Projects with the highest community score#
Fig. 26 - The 40 Projects with the highest size score#
Dimensions and Calculations#
# Each project is ranked according to different indicators in the dimensions of community, activity and size.
# A value of 1 represents the highest rank and 0 the lowest.
# The individual values are summed up within the dimensions to create the scores for the different dimensions.
df_active["activity"] = (
    df_active["total_commits_last_year"].rank(pct=True)
    + df_active["issues_closed_last_year"].rank(pct=True)
    + df_active["days_until_last_issue_closed"].rank(pct=True)
    + df_active["last_released_date"].rank(pct=True, na_option="top")
) / 4

df_active["community"] = (
    df_active["contributors"].rank(pct=True)
    + df_active["development_distribution_score"].rank(pct=True)
    + df_active["reviews_per_pr"].rank(pct=True)
) / 3

df_active["size"] = (
    df_active["total_number_of_commits"].rank(pct=True)
    + df_active["contributors"].rank(pct=True)
    + df_active["closed_issues"].rank(pct=True)
    + df_active["closed_pullrequests"].rank(pct=True)
) / 4

# The scores are summed up and normalised so that 1 represents the largest total score.
df_active["total_score"] = (
    df_active["activity"] / df_active["activity"].max()
    + df_active["community"] / df_active["community"].max()
    + df_active["size"] / df_active["size"].max()
) / 3